8000px x 4500px / EPS, JPG
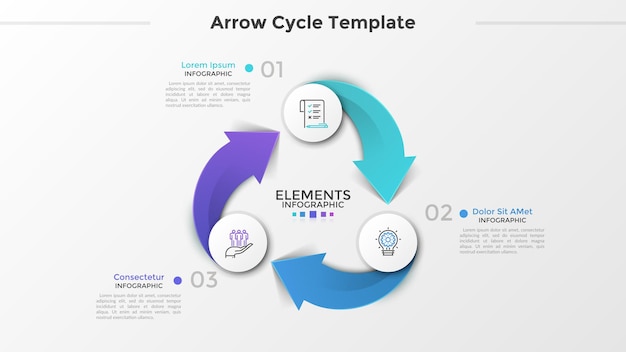
Cyclical chart with 6 paper white circles, thin line icons, numbers and text boxes connected by colorful arrows. Concept of production cycle process. Infographic design template. Vector illustration.
- Premium vector
- LicensePremiumMore info
- infographic presentation
- circle template
- circle
- arrow infographic
- pictogram
- cycle infographic
- circular
- circle diagram
- layout
- layout template
- circle infographic
- diagram
- infographic
- round
- chart
- six
- procedure
- sequence
- arrow circle
- business infographic
- infographic steps
- pointer
- steps
- circular infographic
- business presentation
- business paper
- presentation
- chart template
- plan
- infographic template
- symbol